
The short answer
Prioritize WordPress performance work by the customer task affected, the strength of the evidence, and the dependencies required for a safe fix. Use real-user data to understand experienced performance and controlled tests to investigate causes. Correct a reproducible problem on a critical journey before chasing small score gains on a less important page.
Replace “the site is slow” with a reproducible symptom
Slow can mean several things. The main content takes too long to appear. A navigation control does not respond promptly. A form waits without feedback. A layout moves while someone tries to select an option. Each symptom points to a different investigation, even if the customer describes all of them the same way.
Begin with the tasks your website is supposed to support: evaluate a service, compare products, find a location, submit a qualified inquiry, or complete an order. Select representative pages and record the device, connection, location when relevant, logged-in state, and steps that expose the problem. Include the specific action after the initial page load.
Use customer and staff reports to locate problems, then attempt to reproduce them. A complaint from one user is worth investigating, but it does not establish the experience of every visitor. Likewise, a fast test on an office connection does not disprove a problem elsewhere. Write down what was observed and what remains unknown.
Read field data and lab tests as different kinds of evidence
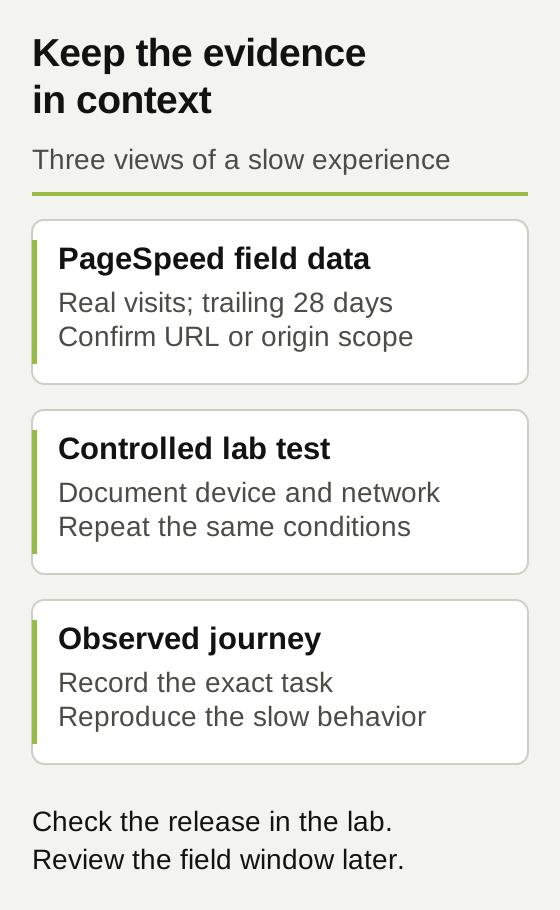
Field data describes real visits across the devices, connections, and behaviors represented in the dataset. Lab tests run under specified conditions and help reproduce or diagnose problems. Google's guide to lab and field differences explains why the two can disagree. Neither should be presented without its conditions and coverage.
Record whether a result describes the exact page, a group of pages, or the wider site. In PageSpeed Insights, field results cover a trailing 28-day period. If a URL has insufficient data, the tool may show origin-level results covering the site; the origin may also lack enough data. Preserve that label with the result. Missing page data is not a passing result for that page, and a site-wide result does not establish the performance of every customer journey.
Keep the same test conditions when assessing a change. Comparing different devices, networks, page states, or content can make ordinary variation look like an improvement. Repeat representative tests and retain the context; do not select only the best run. Immediate lab checks can verify a technical change, while a trailing field window continues to include visits from before the release. Schedule a later field review rather than expecting the historical report to change immediately.
| Evidence | Useful for | Limit to record |
|---|---|---|
| Field performance report | Understanding the experience represented by actual visits. | Date window, device segment, URL or site coverage, and whether enough data exists. |
| Controlled lab test | Comparing conditions and investigating specific loading or rendering work. | Test location, device and network simulation, page state, and run-to-run variation. |
| Observed customer journey | Finding delayed controls, confusing feedback, and task failures. | The exact journey and environment; an observation does not establish population frequency. |
| Application or infrastructure evidence | Locating slow requests and connecting symptoms to a likely cause. | The request, time, environment, and whether the finding explains the customer symptom. |
Use Core Web Vitals as signals, alongside the task
Google's Core Web Vitals guidance describes loading, responsiveness, and visual stability. Its good thresholds are evaluated at the 75th percentile, with mobile and desktop considered separately. When all three metrics have sufficient data, PageSpeed Insights requires all three to be good for its Core Web Vitals assessment to pass.
Read missing-data cases carefully. PageSpeed Insights documents an exception: when INP lacks enough data, good LCP and CLS can produce a passing assessment. If LCP or CLS lacks enough data, it cannot make the assessment. Record which metrics were actually available. A passing label should not be reported as measured proof of responsiveness when INP was unavailable.
Those signals do not establish that a quote reaches sales or that a checkout charges the correct amount. Pair performance measurement with functional testing. A page can become faster while a deferred script stops a form or a menu from working. The customer outcome must remain part of the acceptance criteria.
| Metric | Experience measured | Good threshold |
|---|---|---|
| Largest Contentful Paint (LCP) | Loading of the largest visible content element. | 2.5 seconds or less. |
| Interaction to Next Paint (INP) | Responsiveness to user interactions. | 200 milliseconds or less. |
| Cumulative Layout Shift (CLS) | Unexpected movement of visible content. | 0.1 or less. |
Identify the likely cause and the owner who can change it
An image problem, a slow server response, and a third-party widget need different work. Avoid assigning the entire problem to hosting or to a plugin before the evidence supports that conclusion. Your developer should connect the observed symptom with the requests, assets, or application behavior most likely to explain it.
Design and content decisions can affect performance too. Large visual assets, competing interactive elements, and content that moves after loading may require changes to presentation as well as code. The goal is to preserve the information and functionality customers need while removing unnecessary cost or instability.
Set a clear boundary with the hosting provider. Infrastructure investigation, resource limits, and provider-level configuration may belong with that specialist. Website code, templates, media delivery choices, and integration behavior may belong with the website team. Some problems cross that boundary; name one person to coordinate evidence and the next action so the issue does not bounce between vendors.
Treat third-party scripts as business dependencies. Before changing when a chat tool, analytics tag, consent tool, or payment component loads, identify what it supports and how that function will be tested afterward. Removing an essential function can improve a test score while making the site less useful.
Build a performance triage worksheet your team can act on
Use one row per meaningful symptom, rather than one row per suggestion in a tool report. Several suggestions may contribute to the same customer problem. Conversely, the same template issue may affect many pages and justify a shared fix.
Rank work using customer consequence, supported exposure, confidence in the diagnosis, effort, and dependencies. If exposure or effort is unknown, say so and assign the next investigation. A precise-looking score made from guesses will not make the decision more reliable.
| Record | Question to answer | Decision it supports |
|---|---|---|
| Journey and symptom | Which task is delayed or disrupted, and where can we reproduce it? | Whether this problem affects an important business interaction. |
| Evidence and coverage | What do the field report, repeated tests, and observed journey show? | How confidently the symptom is established and whom it may affect. |
| Suspected cause | What technical evidence connects the symptom to a changeable cause? | Whether to implement a fix or investigate further. |
| Owner and dependency | Who can make the change, and what approval or vendor action is required? | The practical sequence and coordination needed. |
| Acceptance and recovery | What must improve, what must still work, and how can the change be reversed? | Whether a release is ready and whether it should remain in place. |
Your working worksheet
Plan your performance investigation
Use this checklist to distinguish a measured customer problem from an unexplained score. The next actions help your team collect evidence before spending time on fixes.
Your entries stay in this page. This tool does not send or save them. Download your worksheet to keep a copy; reloading the page clears your entries.
Choose Verified only when you have supporting evidence. These are counts of your answers, not a maturity benchmark or a prediction of results.
0 verified; 0 need work; 8 unknown.
| Group | Verified | Total questions |
|---|---|---|
| Evidence | 0 | 3 |
| Diagnosis | 0 | 3 |
| Release | 0 | 2 |
Next actions
- Unknown: The affected URL, device, task and reproducible symptom are recorded.
Record the exact journey and a repeatable test environment.
- Unknown: Field data is labeled as page-level or origin-level with its reporting window.
Check whether your report describes this page or the origin and note the data window.
- Unknown: Repeated lab tests use a consistent device and network profile.
Repeat the same test conditions and preserve the result before changing anything.
- Unknown: Likely causes have supporting traces or observations.
Inspect images, scripts, server response and task behavior before choosing a fix.
- Unknown: The change owner and affected dependencies are identified.
Name the developer, provider or content owner who can change the suspected cause.
- Unknown: The fix is tied to a customer task and a measurable acceptance check.
Write the expected task improvement and how it will be retested.
- Unknown: The change has a safe test environment and rollback plan.
Test the change in staging and preserve a recovery route.
- Unknown: Forms, navigation, commerce and later field evidence are in the review plan.
Check neighboring functions after release and revisit field data after its reporting window updates.
Assumptions and calculation notes
- Select Verified only when you have current evidence for the stated check. Needs work records a known gap; Unknown means the evidence is missing.
- Bars count verified checks in each group. Checks are equally counted and are not a weighted risk score, certification, performance benchmark or recommendation to buy a particular service.
- Use the downloaded worksheet to assign owners, evidence and dates with your team. Revisit it after changes; a completed checklist does not guarantee future results.
Choose the first action from the evidence you have
If a customer task fails, reproduce it and assign the functional investigation even when the page has a good performance score. If field data is poor but you cannot reproduce the issue, compare the affected device group, page coverage, and conditions before choosing a fix. If only one lab run looks poor, repeat the test under recorded conditions and inspect the likely cause. These are different starting points, not three grades on the same scale.
For the first implementation, write one acceptance sentence: on the specified page and device, the observed delay or movement improves under the original conditions, and the customer's task still completes correctly. Add the technical measure where it is available. That sentence connects a developer's change to the reason the business commissioned the work.
A worked example: the inquiry journey matters more than the homepage score
Imagine a hypothetical B2B supplier whose leadership is concerned about a homepage performance score. Sales also reports that the product inquiry form sometimes appears unresponsive on mobile. The team has no measured revenue loss and should not invent one. The first job is to establish what customers experience.
A controlled review reproduces delayed feedback on the inquiry form and identifies a third-party dependency for further investigation. A separate homepage image opportunity is straightforward, but it does not explain the form symptom. Field coverage for the exact inquiry page is insufficient, so the team records that limitation rather than labeling the page healthy or unhealthy for all visitors.
The first scope addresses the form's response and confirms the dependency's role. Acceptance requires a representative inquiry to submit once, reach the intended destination, show understandable feedback, and work with the supported consent behavior. It also includes performance checks under the original test conditions. The image improvement can proceed as a separate bounded task when resources allow.
After release, the team verifies the journey and monitors available evidence. It can report that the reproduced issue was corrected if the checks establish that result. It cannot claim a conversion or revenue increase without a suitable observation period and a comparison that accounts for other changes. This distinction makes the report more useful to leadership, not less.
Verify the improvement and the neighboring functions
Agree the verification plan before changing the site. Save the baseline, test conditions, intended behavior, and recovery method. Use a suitable staging environment for changes that can affect transactions, forms, or shared templates, then perform controlled verification of the released result.
Check the neighboring functions that share the affected code or template. An improvement to one product page may alter another product type. A change to shared scripts may affect navigation, consent, tracking, or forms. The test scope should follow those dependencies rather than stopping at the page that first drew attention.
Before-and-after verification checklist
- Save the page, device, network conditions, account state, and relevant test results before work.
- Record the intended improvement and the person responsible for accepting it.
- Repeat the original failing or slow journey under comparable conditions.
- Confirm that forms, navigation, commerce, consent, and relevant measurement still behave as intended.
- Check representative pages that share the changed template or dependency.
- Record deployment time, limitations, recovery instructions, and the next field-data review.
Make performance part of normal website ownership
A site changes as teams publish media, install tools, adjust templates, and add campaigns. Agree which changes trigger a performance review and who owns that review. Critical customer journeys should have a short, repeatable check that does not depend on remembering how the last project was tested.
Keep monitoring proportionate to the business. A commerce operation with frequent changes may need a different review cadence from a stable service website. Choose alerts and reports that someone can act on, with a clear route from an observation to investigation and resolution.
Report customer-task improvements, verified technical changes, and remaining uncertainty separately. Avoid promising a permanent perfect score. The useful commitment is a repeatable process for identifying problems, making justified improvements, and checking that the site continues to support the business.
How to interpret the worksheet and thresholds
The thresholds in this guide come from Google's official documentation; they are not AV Social client measurements or revenue benchmarks. Use the worksheet with your own dated field reports, repeated lab tests, and observed tasks. Keep each metric's units and coverage visible. The hypothetical inquiry-form example illustrates prioritization, not a measured conversion result. A threshold comparison helps interpret evidence; it does not replace a diagnosis or a test of the complete customer journey.
Start with a focused performance diagnostic
AV Social brings WordPress development, design, SEO, and measurement into the same conversation so a performance issue can be connected to the customer experience it affects. We can work with your hosting specialist where infrastructure evidence is needed and define which improvements belong with the website team.
Explore our website performance optimization services or tell us which WordPress journey is causing trouble. Bring the page, the observed symptom, and any existing reports. A useful first scope ends with evidence, priorities, accountable owners, and a verification plan.
Sources and further reading
Platform documentation supports the technical guidance above. The worksheets are AV Social's decision aids; their outputs use your entries and the stated assumptions.